
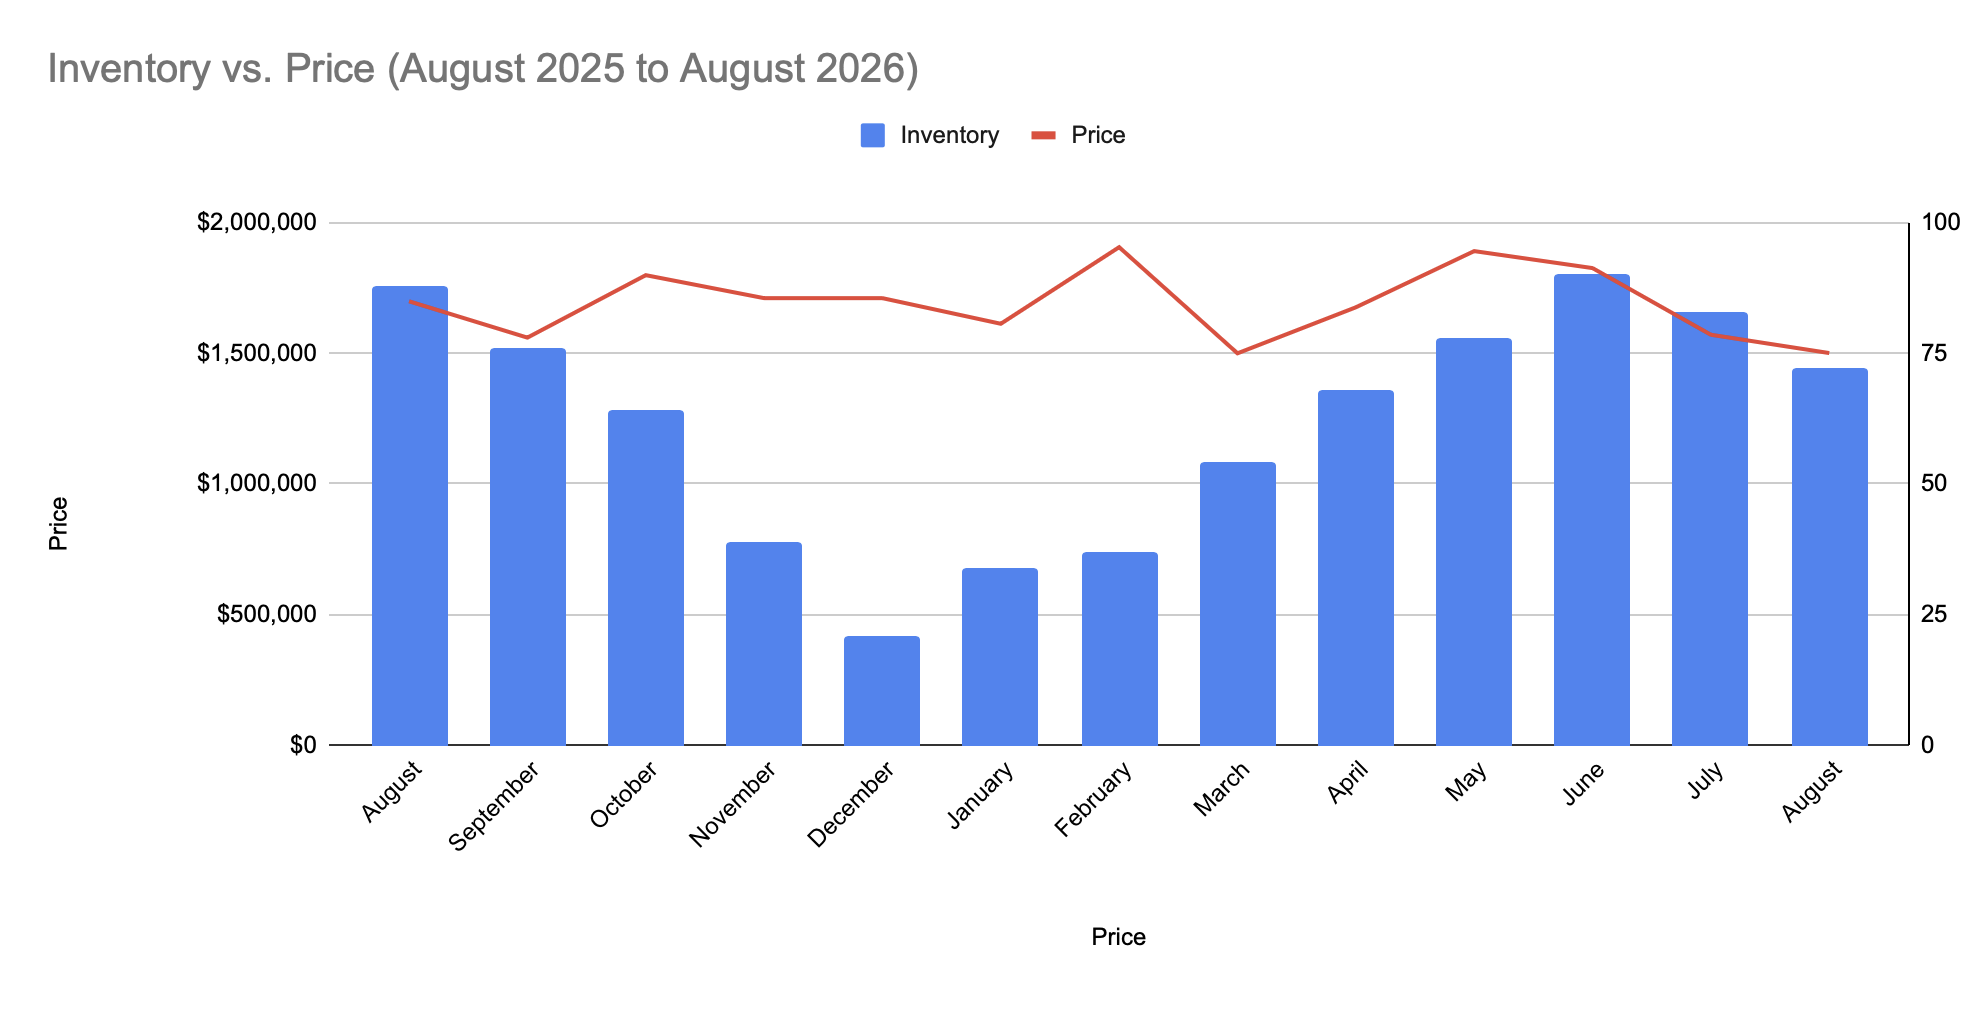
August delivered the first real crack in Pleasanton's price story this year. The median sale price dropped to $1,500,000, down nearly 10% from a year ago, and homes took longer to sell than any other month we've tracked. It's not a dramatic shift, but it's the first month where more numbers point down than up, and that's worth understanding, not glossing over.
AUGUST BY THE NUMBERS
Median sale price: $1,500,000 (down 9.69% year-over-year)
Average sale price: $1,609,618 (down 14.9% year-over-year)
Homes sold: 37 (down 11.9% year-over-year)
Average days on market: 36 (up 24.1% year-over-year)
Sale price to list price ratio: 99% (up from 97% a year ago)
Active listings: 72 (1.9 months of supply)
Average price per square foot (sold): $836
Source: Bay East Association of REALTORS® MLS
THE STORY BEHIND THE NUMBERS
This is the first month since these reports began in May that the median and average sale price have both moved down year-over-year, rather than up. With only 37 sales in the month, a single high-end deal (or the absence of one) can swing a median — so I don't want to overread one month in isolation. But the signal shows up in more than just the median: average days on market climbed to 36, the slowest pace of any month in our 13-month dataset, and the average sale price fell even more sharply than the median, down 14.9%. When multiple metrics move the same direction at once, it's a real trend, not noise.
At the same time, sellers who are priced right are still landing close to home. The sale-to-list ratio actually improved to 99%, up from 97% a year ago — meaning well-positioned homes are still fetching close to full asking price, even as the overall pace slows and prices soften. That's the tension worth sitting with: this is a cooler market, but it isn't a market where sellers are getting picked apart on price once an offer comes in.
Zooming out to the 13-month trend, this softening lines up with a normal seasonal pattern — spring 2026 saw the year's highest medians (Feb through April), and late summer has historically been quieter. What's different this year is that the year-over-year comparison turned negative too, not just the month-over-month seasonal dip. That's the piece to keep watching in September.
WHERE THE MARKET IS MOVING
"The market" is never just one market — and August is a good reminder why.
The clearest story is at the top: the $3M+ segment, which led all of last year's pace through May (22 sales vs. 21), slipped one sale behind in June, and has now fallen to 29 sales year-to-date versus 40 at this point in 2025 — an 11-sale gap that has only widened each time I've checked it. Three months running, the direction has been the same: the luxury segment is cooling faster than the rest of the market.
Meanwhile, the $1.3–1.699M band remains the workhorse of Pleasanton real estate: 102 of 277 year-to-date sales, or 36.8% of all activity — actually a slightly larger share than June's 35.7%. While the top of the market pulls back, this core band keeps doing the heavy lifting.
Total sales volume for the year continues to run behind 2025's pace — 277 homes sold year-to-date versus 351 by this point last year, a 21.1% shortfall. That gap is essentially unchanged in percentage terms from June (it was 20.7% behind then), so this isn't an accelerating collapse in volume — it's a steady, consistent shortfall that's held for months.
I track these segments every single month, not just the headline number. When a trend holds, I'll tell you. When it breaks, or when it deepens like the $3M+ segment has, I'll tell you that too.
WHAT THIS MEANS IF YOU'RE SELLING
Thirty-six days is the slowest average marketing time we've tracked all year, and this is the first month where price growth has actually gone negative year-over-year. That combination means pricing discipline matters more right now than at any point in 2026 so far. The encouraging counterpoint: homes that are priced and prepared well are still closing at 99% of list price, on average, so this isn't a market where sellers are taking a beating once they're under contract. The risk is overpricing and sitting.
If you’re thinking of selling in Pleasanton and own in the $3M+ range, take this seriously: that segment has fallen further behind last year's pace for three straight months, and the gap is now double digits. Sharp pricing, strong staging, and realistic expectations about timeline matter more here than in any other price band right now. If you're in the $1.3–1.7M range, you're still in the busiest lane in town, but "busiest" doesn't mean effortless, buyers have more selection than they did in spring.
WHAT THIS MEANS IF YOU'RE BUYING
For the first time all year, the numbers are genuinely leaning in favor for buyers in Pleasanton. Prices are down year-over-year, days on market are up, and at 72 active listings and 1.9 months of supply, you have room to actually think before making an offer instead of feeling rushed. If you're relocating from the South Bay (Fremont, Milpitas, San Jose, Cupertino) this could be one of the more forgiving windows Pleasanton has offered this year to compare homes side by side rather than competing in a bidding sprint. That said, sellers are still averaging 99% of list price, so this isn't a market where lowball offers are landing, it's a market with more time and more selection, not necessarily more room to negotiate hard on price.
FREQUENTLY ASKED QUESTIONS
What was the median home price in Pleasanton in August 2026?
The median sale price for detached single-family homes in Pleasanton was $1,500,000 in August 2026, down 9.69% from August 2025's $1,661,000, the first year-over-year price decline reported since these monthly updates began.
Is Pleasanton a buyer's or seller's market right now?
With 1.9 months of supply and homes still selling at 99% of list price on average, Pleasanton remains technically a seller's market, though conditions have eased noticeably compared to spring 2026.
How long are homes taking to sell in Pleasanton?
The average days on market was 36 in August 2026, up from 29 days in August 2025 and the slowest pace of any month tracked in this report series so far.
Are home prices in Pleasanton going up or down?
Down, for the first time since these reports began tracking the market in May 2026. The median sale price fell 9.69% and the average sale price fell 14.9% compared to August 2025.
Which price segment is strongest right now?
The $1.3–1.699M range remains the busiest, accounting for 36.8% of all 2026 year-to-date sales. The $3M+ luxury segment has cooled the most, now trailing last year's pace by 11 sales year-to-date after leading it as recently as May.
Is now a good time to sell in Pleasanton?
It depends on price point and preparation. Homes that are priced accurately and presented well are still closing near full asking price, but the market is slower and softer than earlier this year, especially above $3M, where pricing discipline matters most right now.
CLOSING
Twenty-one years of tracking this market has taught me that a single headline number rarely tells the whole story — especially in a month like this one, where the trend is real but the size of the shift deserves context, not alarm. I break the numbers down every single month, streaks and reversals both, so you have the full picture. If you're thinking about buying or selling in Pleasanton or anywhere in the Tri-Valley, I'd love to talk through what this data means for your specific situation.
Katie Moe | Connect California Homes | 925-216-9083 | katie@connectcahomes.com | DRE #01507863