Pleasanton Real Estate Market Report — July 2026

July confirmed a trend rather than introducing a new one. Prices eased from a year ago, sales stayed well below last July's pace, and for the third straight month, two of the storylines we've been tracking all summer got more pronounced instead of less — the gap between this year's and last year's sales volume widened again, and the top of the market's pullback deepened further. Here's the full breakdown, month by month and segment by segment.
JULY BY THE NUMBERS
Median sale price: $1,570,000 (down 6.52% year-over-year)
Average sale price: $1,626,028 (down 19.8% year-over-year)
Homes sold: 40 (down from 58 in July 2025)
Average days on market: 27 (vs. 31 a year ago)
Sale price to list price: 98%
Active listings: 83 (2.0 months of supply)
Average price per square foot (sold): $801
Source: Bay East Association of REALTORS® MLS
THE STORY BEHIND THE NUMBERS
Pricing cooled from a year ago in July. Both the median and average sale price are down year-over-year, and the sale-price-to-list-price ratio dipped to 98% — the first time this year it's dropped below 100%, after sitting there in May and June. Reported days on market held at 27, faster than last July's 31, though that number is worth taking with a grain of salt: DOM resets whenever a listing is withdrawn and relisted, so it reflects time at the current asking price, not necessarily a home's full cumulative time on the market. True time-to-sell for homes that got repriced along the way likely runs higher than the headline figure suggests. Paired with the sale-to-list ratio slipping below 100%, though, the direction of the signal is consistent either way: the pricing math has shifted a notch in buyers' favor.
Worth flagging before reading too much into the median specifically: on a base of just 40 sales, the headline number can swing more than the underlying market actually moved. July's $1,570,000 median is down sharply from June's $1,825,000, but this data set has bounced between $1,470,000 (March) and $1,900,000 (February) all year on similarly small monthly samples. Some of that swing is genuinely a cooling market; some of it is just which homes happened to close. Year-over-year comparisons are the more reliable read here.
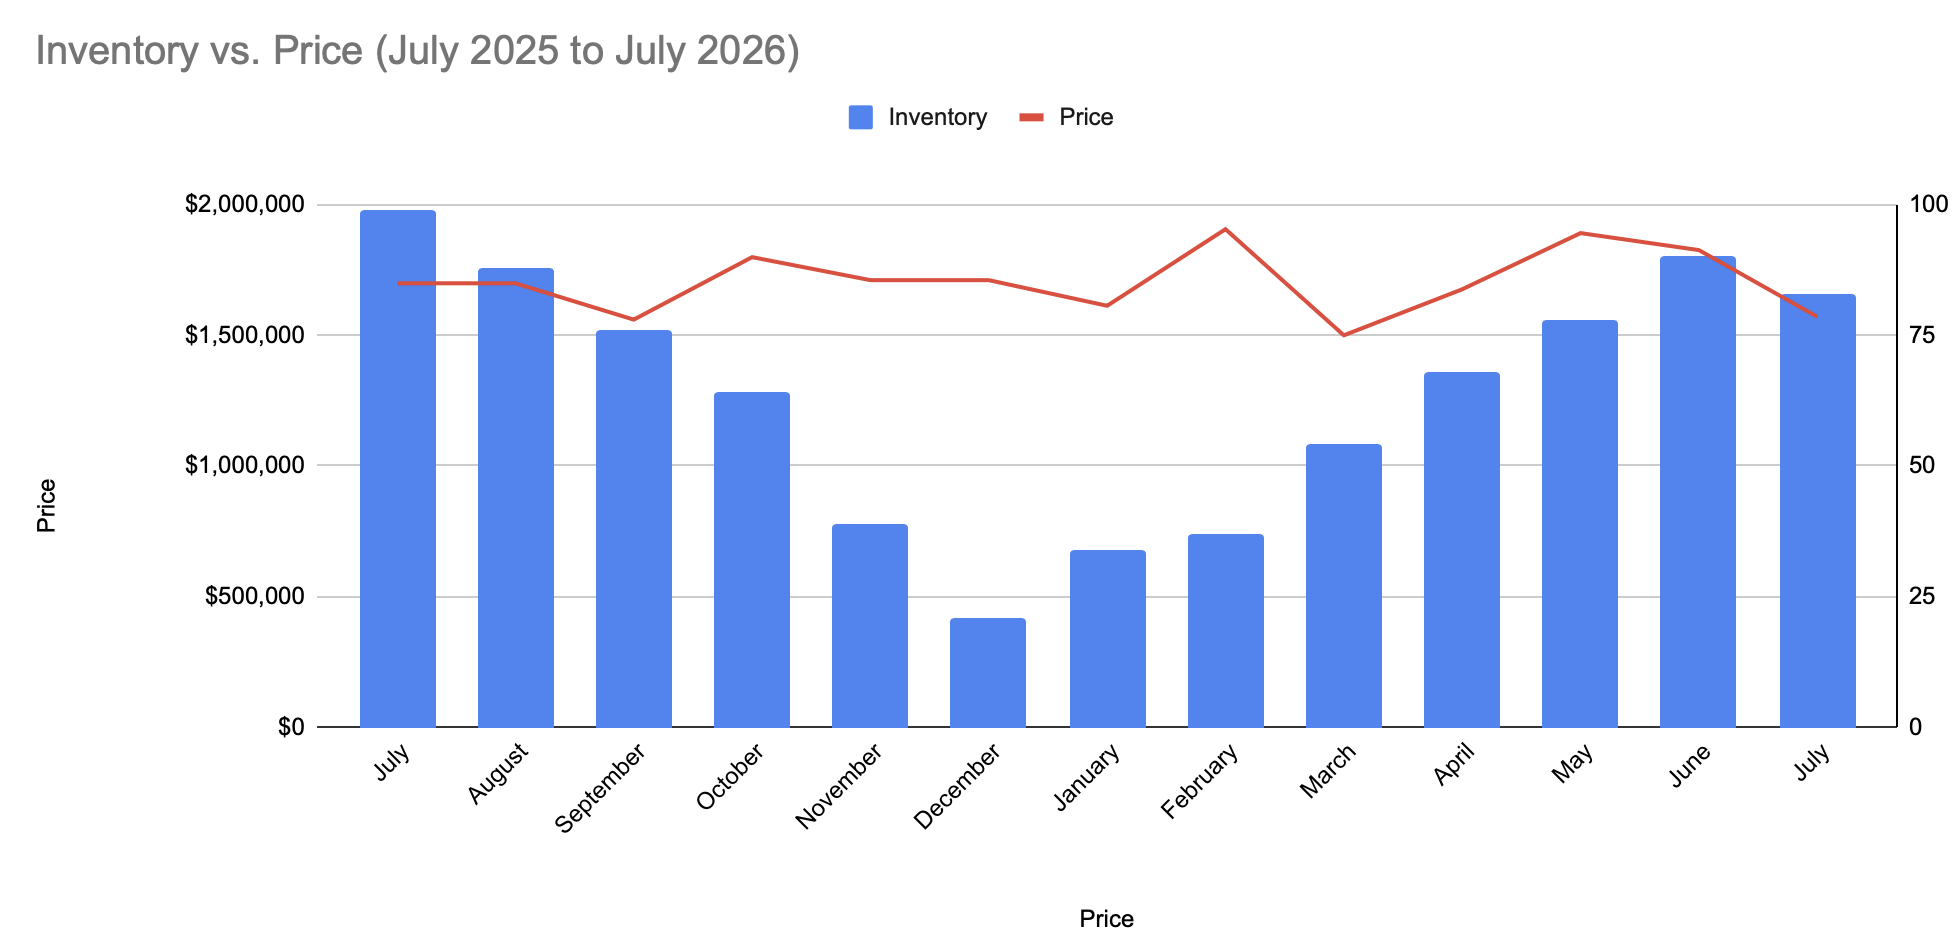
Volume told a steadier story. Forty homes sold in July, actually up slightly from June's 38, but still 31% behind last July's 58 — and that year-over-year gap has now widened for three straight months running (14.9% behind in May, 20.7% behind in June, 22.7% behind in July, looking at year-to-date totals). Inventory, meanwhile, pulled back for the first time in six months: 83 active listings at month's end, down from June's 90, and months of supply eased to 2.0 from 2.3.
WHERE THE MARKET IS MOVING
"The market" is never just one market, and July's data makes that especially clear — the story at the top of the market and the story in the market's center of gravity are now pointing in different directions.
The $3M+ segment's reversal deepened for a third straight month. Back in May, this band had already matched all of last year's full-year pace: 22 sales year-to-date versus 21 at that point in 2025. That streak broke in June, when it slipped one sale behind (27 vs. 28). By July, the gap has widened sharply to nine sales behind (28 vs. 37 year-to-date) — the third consecutive monthly reading, and each one has been worse than the last. Some of that gap is a tough comparison: July 2025 alone saw nine $3M+ closings, one of the segment's strongest single months in this data set. But three straight months of deterioration, tough comp or not, could be a real trend worth noting, I will continue to follow this.
The $1.3–1.699M band, by contrast, is holding its ground. It accounts for 90 of the 239 homes sold so far this year, or 37.7% of all activity — essentially back to where it started the year (37.5% in May) after dipping to 35.7% in June. It remains the largest single segment by a wide margin, more than double the next-largest band, and its year-over-year decline (-14.3%) is milder than the market-wide decline (-22.7%).
The weakest spot is the $2–2.999M band, down 32.4% year-to-date versus 2025 and now just 20.1% of total activity, down from 23.0% a year ago — the steepest pullback, in both count and share, of any meaningfully sized segment.
Zooming out, total year-to-date sales volume is now running 22.7% behind 2025's pace, the widest gap of the year and the third straight month that gap has widened.
I track these segments every month, not just the headline median. When a streak holds, you'll read it here. When it breaks — or keeps breaking, like the $3M+ band this summer — you'll read that too.
WHAT THIS MEANS IF YOU'RE SELLING
Homes are still selling quickly on paper, and 98% of asking is still a strong result, but it's the first month this year Pleasanton sellers haven't been getting full price on average. That's a real, if modest, shift in leverage. Pricing precisely — rather than pricing optimistically and expecting the market to catch up — matters more now than it did in the spring, and that's especially true if a listing has already been repriced once; the reported clock resets, but buyers remember. If your home sits in the $3M+ range, take the segment data seriously: buyer depth at the top of the market has thinned for three months running, and this is not the moment to test the market with an aggressive number. If you're in the $1.3–1.7M range, you're still in the busiest lane in Pleasanton, with the most consistent buyer competition of any price band.
WHAT THIS MEANS IF YOU'RE BUYING
Inventory eased slightly in July — 83 active listings versus June's 90 — but that's still meaningfully more selection than Pleasanton buyers had at the start of the year, and homes are no longer routinely fetching over asking. If you're relocating from the South Bay — Fremont, Milpitas, San Jose, or Cupertino — this is a market where you can negotiate on price and terms in a way that wasn't realistic here a year ago, particularly outside the $1.3–1.7M core where competition is still steadiest. And don't read a listing's "27 days on market" at face value — ask how long it's actually been for sale; a relist often means there's more room to negotiate than the headline number implies.
FREQUENTLY ASKED QUESTIONS
What was the median home price in Pleasanton in July 2026?
The median sale price for detached single-family homes in Pleasanton was $1,570,000 in July 2026, down 6.52% from July 2025.
Is Pleasanton a buyer's or seller's market right now?
By classic measures it's still a seller's market — 2.0 months of supply is well under the 5–6 months that typically signals balance, and homes are still selling in under a month on average. That said, the sale-to-list ratio dropped below 100% for the first time this year, a sign the balance is shifting modestly toward buyers.
How long are homes taking to sell in Pleasanton?
The reported average was 27 days in July 2026, up from June's 23 but still faster than the 31-day average from July 2025. Worth noting: this figure resets whenever a listing is withdrawn and relisted, so it measures time at the current asking price rather than a home's true cumulative time on the market — actual time-to-sell for repriced listings is likely higher than the headline number suggests.
Are home prices in Pleasanton going up or down?
Prices are down year-over-year. The median sale price fell 6.52% and the average sale price fell 19.8% compared to July 2025.
Which price segment is strongest right now?
The $1.3–1.699M range remains the busiest segment, accounting for 37.7% of all 2026 year-to-date sales and holding up better than the overall market. The $3M+ luxury segment, which had been outpacing last year's pace through May, has now fallen nine sales behind 2025's pace, a gap that has widened for three straight months.
Is now a good time to sell in Pleasanton?
Homes are still selling quickly and close to asking price, but July was the first month this year sellers didn't average full price. Precise pricing matters more now than it did earlier in the year, especially at the top of the market.
CLOSING
Twenty-one years of tracking this market has taught me that the headline number is rarely the whole story — the segment-level detail is where the real signal is. I break it down every single month so you have the full picture, not just the median. If you're thinking about buying or selling in Pleasanton or anywhere in the Tri-Valley, I'd love to talk through what this data means for your specific situation.
Katie Moe | Connect California Homes | 925-216-9083 | katie@connectcahomes.com | DRE #01507863