Pleasanton Real Estate Market Report — June 2026

June brought a shift worth paying attention to. Pricing held its ground, sellers kept getting full asking price, but the number of homes changing hands slowed compared to last year's pace, and for the first time all year, Pleasanton's $3M+ segment lost a lead it had spent months building. Here's what the data says, month by month and segment by segment.
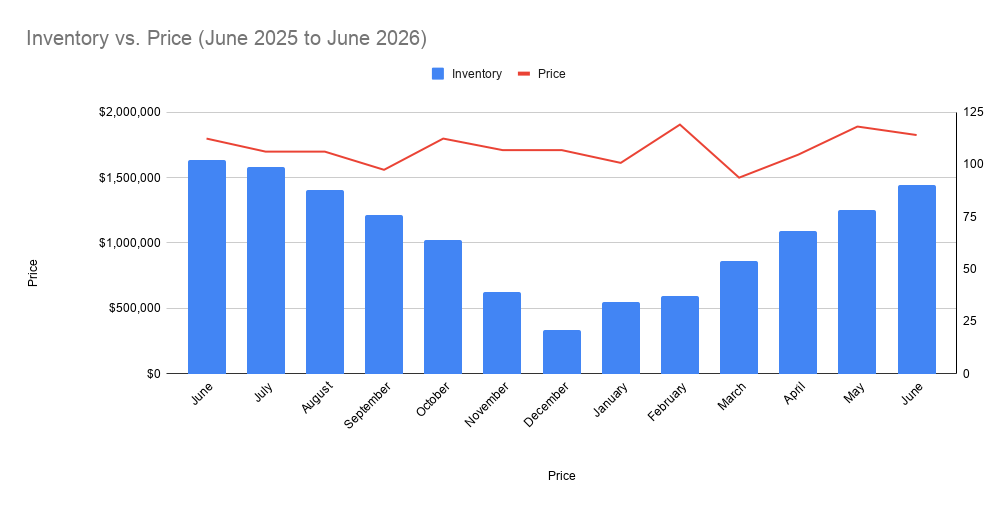
June by the Numbers
Median sale price: $1,825,000 (+3.11% year-over-year)
Average sale price: $2,095,265 (+6.02% year-over-year)
Homes sold: 38 (down from 63 in June 2025)
Average days on market: 23 (vs. 26 a year ago)
Sale price to list price: 100%
Active listings: 90 (2.3 months of supply)
Average price per square foot (sold): $820
Source: Bay East Association of REALTORS® MLS
The Story Behind the Numbers
Start with the good news: pricing discipline hasn't budged. Median and average sale prices are both up year-over-year, and buyers are still paying 100 cents on the dollar of asking price, exactly where this market has sat for months. Homes that go on the market well-prepared and accurately priced are still moving quickly; even with days on market ticking up from May's 21 to 23 this month, that's still noticeably faster than last June's 26-day average.
Where the story gets more complicated is volume. Thirty-eight homes sold in June, down from 49 in May and well below last June's 63, though it's worth noting that last June was actually the single strongest month of sales in this entire 13-month data set, so some of that year-over-year gap is a high bar, not necessarily new weakness. What is new is the inventory picture: active listings have climbed for six straight months, from a low of 22 in December to 90 now, the highest active count since last August.
I saw this play out firsthand this spring with a listing that told the story in miniature: priced ambitiously at the start, held open nearly every weekend for three months straight with consistent showings, two price reductions along the way, and it still didn't sell before the sellers ultimately took it off the market. That's not a failure of marketing or exposure. It's what happens when a home's asking price and the market data diverge, and the gap doesn't close in time.
Put together, that's a market that's still rewarding sellers who price right, but is quietly giving buyers more room to breathe than they've had all year. Neither trend is dramatic on its own. Together, they're worth watching.
Where the Market Is Moving
"The market" is never just one market, especially in Pleasanton, and this month, the segment that's been carrying the headline changed direction.
Back in May, Pleasanton's $3M+ segment had already matched all of last year's full-year sales pace: 22 homes sold year-to-date versus 21 by that same point in 2025. That streak broke in June. The $3M+ band now sits at 27 sales year-to-date versus 28 at this point last year, one sale behind, after leading a month ago. It's a narrow gap, and one strong closing could flip it right back. But the honest read is that the top of the market cooled off its early lead rather than extending it.
The $1.3–1.699M band remains the true center of gravity: 71 of the 199 homes sold so far this year, or just over a third of all activity, still the largest single segment, even as its share has eased slightly from May (37.5% then, 35.7% now).
Zooming out, total sales volume for the year continues to run behind 2025's pace, and that gap widened this month: 199 homes sold year-to-date versus 251 by this point last year, a wider gap than May's comparison. Every price band except two negligible-volume tiers is running behind last year's count.
I track these segments every single month, not just the headline median. When a streak holds, I'll tell you. When it breaks, like this month , I'll tell you that too.
What This Means If You’re Selling
Sellers in Pleasanton have a few things to consider in our current market. Full-price offers and 23-day average marketing times mean well-priced, well-prepared listings are still winning. But rising inventory (six straight months of growth, now at the highest active count since August) means you're no longer the only option on the block the way sellers were in December or January. If you're sitting in the $3M+ range, pricing sharply matters more this month than it did in May, that segment just gave up ground it had been gaining. If you're in the $1.3–1.7M range, you're still in the market's busiest lane, but "busiest" doesn't mean "easiest" as buyers in that band have real alternatives now. And as the story above shows, holding firm on a price the data doesn't support is a real risk right now, not just a theoretical one.
What This Means If You’re Buying
Ninety active listings is the most selection Pleasanton buyers have had since last August, and average days on market of 23 means you have a bit more breathing room to make a decision than earlier in the spring. If you're relocating from the South Bay: Fremont, Milpitas, San Jose, or Cupertino this is a good window to actually compare homes side by side instead of feeling rushed into the first one that fits. Sellers are still getting full asking price on average, so lowball offers still aren't landing, but you have more to choose from while you look.
Frequently Asked Questions
What was the median home price in Pleasanton in June 2026?
The median sale price for detached single-family homes in Pleasanton was $1,825,000 in June 2026, up 3.11% from June 2025.
Is Pleasanton a buyer's or seller's market right now?
By classic measures it's still a seller's market, homes are selling at 100% of list price with 2.3 months of supply, well under the 5-6 months that typically signals balance. That said, active inventory has grown for six straight months, giving buyers more selection than they've had since last summer.
How long are homes taking to sell in Pleasanton?
The average days on market in June 2026 was 23 days, up slightly from May's 21 days but still faster than the 26-day average from June 2025. It remains whether this is an accurate data point with homes being delisted and relisted at lower prices all the time. I still believe that Days on Market is not a valid data point in this market.
Are home prices in Pleasanton going up or down?
Prices are up year-over-year. The median sale price rose 3.11% and the average sale price rose 6.02% compared to June 2025.
Which price segment is strongest right now?
The $1.3–1.699M range remains the busiest segment, accounting for just over a third of all 2026 year-to-date sales. The $3M+ luxury segment, which had been outpacing last year's sales pace through May, slipped slightly behind 2025's pace in June.
Is now a good time to sell in Pleasanton?
Sellers are still getting full asking price on average and homes are moving in about three weeks. Rising inventory means positioning and pricing matter more than they did earlier this year, but well-prepared listings are still performing well.
Closing
Twenty-one years of tracking this market has taught me that the headline number is rarely the whole story, the segment-level detail is where the real signal is. I break it down every single month so you have the full picture, not just the median. If you're thinking about buying or selling in Pleasanton or anywhere in the Tri-Valley, I'd love to talk through what this data means for your specific situation.
Katie Moe | Connect California Homes | 925-216-9083 | katie@connectcahomes.com | DRE #01507863
More Blogs You Might Find Interesting
Pleasanton Real Estate Market Report - May 2026 | Link
Pleasanton Meadows Success: How Strategic Positioning Led to 50+ Buyers in One Weekend | Link
Selling Your Home in Summer: Pros and Cons for Tri-Valley Homeowners | Link
2026 East Bay Area Housing Market Outlook | Link
Thinking of Selling a Home in the Tri-Valley? What Every Homeowner Needs to Know Before Listing | Link