Pleasanton Real Estate Market Report – September 2026

September handed Pleasanton a mixed report card. The median sale price climbed back above last year's level after two straight months of year-over-year declines, yet homes took longer to sell than in any month we've tracked. And underneath the headline, the market is quietly splitting in two, with the dividing line sitting right around $1.7 million.
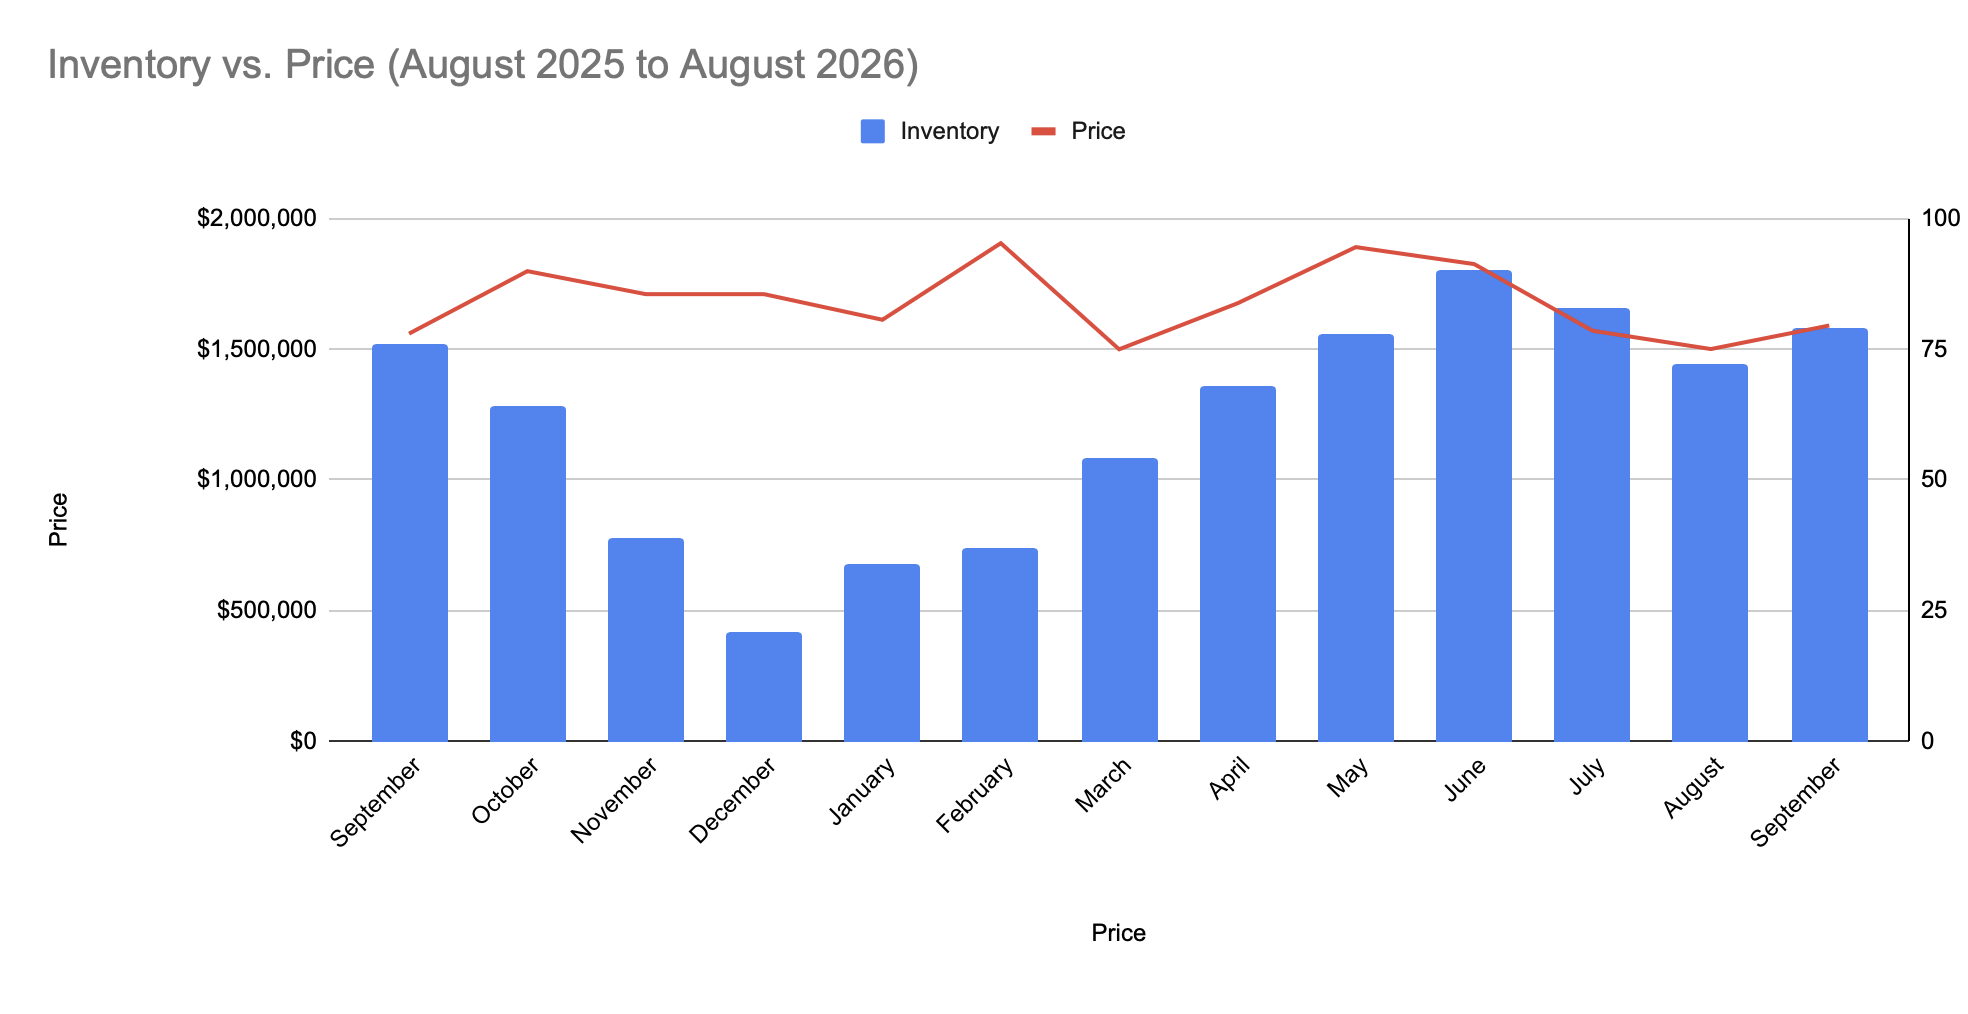
September by the Numbers
Median sale price: $1,590,000 (up 4.13% year-over-year)
Average sale price: $1,972,899 (up 0.83% year-over-year)
Homes sold: 40 (down 24.53% from 53 in September 2025)
Average days on market: 37 (vs. 26 a year ago)
Sale price to list price: 98% (vs. 99% a year ago)
Active listings: 79 (2.0 months of supply)
Average price per square foot (sold): $816
Source: Bay East Association of REALTORS® MLS. Pleasanton and Sunol, detached single-family homes.
The Story Behind the Numbers
After July (down 6.52%) and August (down 9.69%), the median sale price turned positive again year-over-year in September. That's real, but it deserves context before anyone calls it a rebound. Last September's median of $1,527,000 was one of the softest readings in the past 13 months, which makes this year's comparison an easy one to beat. The average sale price also jumped from $1,609,618 in August to $1,972,899, and most of that came from a burst of six closings above $3 million. The steadier measure, average price per square foot, actually eased to $816 from August's $836 and is essentially flat with last September's $813. My honest read: prices have stabilized, not taken off.
Pace is the clearer signal. Average days on market reached 37, the highest of any month in this 13-month data set, and the number has now risen every single month since April: 14, 21, 23, 27, 36, and now 37. I'll repeat a caution I've raised before: days on market resets when a listing is withdrawn and relisted, so it measures time at the current price, not a home's full time for sale. If anything, true marketing times are running longer than the headline. The sale-to-list ratio slipped to 98%, from 99% in August.
The inventory comparison tells the story neatly. There were 79 active listings at the end of September, nearly identical to last September's 81. Same number of homes for sale, but 40 closings instead of 53. That's why months of supply sits at 2.0 today versus 1.6 a year ago. Pending sales held at 30, matching August, so the pipeline heading into fall is steady rather than drying up.
Where the Market Is Moving
If you only read the median, you'd think Pleasanton had one market this month. The price-band data says it has two.
Below $1.7 million, the market is holding up. Homes under $1.7M account for 163 sales so far this year, versus 194 at this point in 2025, a decline of 16.0%. The core $1.3–1.699M band is the standout: 118 sales year-to-date, which is actually ahead of the same point in both 2023 (115) and 2024 (107). It now makes up 37.2% of all 2026 sales, up from 36.8% in August, and it delivered 16 of September's 40 closings.
Above $1.7 million, it's a different picture. Those homes account for 154 sales year-to-date versus 210 last year, a 26.7% decline. And every price band above $1.7M is now at or tied for its lowest year-to-date count of the five years Bay East reports (2022 through 2026):
$1.7–1.999M: 62 sales (previous five-year low: 77)
$2–2.999M: 57 sales (tied with 2023)
$3M+: 35 sales (previous five-year low: 36)
The $3M+ streak, month five. In May this segment was ahead of last year's pace (22 sales vs. 21). It slipped one behind in June (27 vs. 28), fell nine behind in July (28 vs. 37), eleven behind in August (29 vs. 40), and now sits thirteen behind (35 vs. 48). That's the fourth straight month the gap has widened. But here's the nuance worth noticing: September brought six $3M+ closings, nearly as many as June, July, and August combined (seven). The gap widened only because September 2025 was stronger still, with eight. So the top of the market showed genuine life this month. Whether that's the start of a turn or a one-month burst is exactly what October will tell us.
The $2–2.999M band remains the steepest decline of any meaningfully sized segment, down 32.9% year-to-date, just as it was when I flagged it in July. Its share of total activity has fallen to 18.0%, from 21.0% at this point last year.
Zooming out, total year-to-date volume stands at 317 sales versus 404 last year, 21.5% behind. That gap has stayed in a tight 21–23% range since June, so volume isn't collapsing; it's running at a consistently slower pace. Still, 317 is the lowest year-to-date total of the five years in the report, below even 2023's 329.
I track these segments every month, not just the headline median. When a streak holds, you'll read it here. When it breaks, or shows the first crack like the $3M+ band did this month, you'll read that too.
What This Means If You're Selling
For home sellers in Pleasanton, your price point matters more this fall than it has all year. If your home will list below $1.7M, you're in the busiest part of Pleasanton's market, with the core band running ahead of 2023 and 2024. Buyers are there. But with an average of 37 days on market, preparation and accurate pricing are what separate a quick sale from a stale one.
If you own above $1.7M, the buyer pool is thinner than it's been in any of the past five years. That doesn't mean homes aren't selling. September's six $3M+ closings prove the right home at the right price still finds its buyer. It means pricing to today's market, not to last spring's, and planning for a longer timeline. Homes are still closing at 98% of list price on average, so the risk isn't getting picked apart once you're in contract. The risk is overpricing and sitting. If you're weighing whether to list this fall or wait for spring, that's a conversation worth having now, with your specific numbers in front of us.
What This Means If You're Buying
If you’re buying a home in Pleasanton, you have more time than buyers had a year ago: 79 active listings, 2.0 months of supply versus 1.6 last September, and homes averaging 37 days on market. Where you shop matters, though. The $1.3–1.7M range is where you'll still face the most competition. Above $1.7M, sales are running at a five-year low, which typically means more room to negotiate on price, terms, and timing.
If you're relocating from the South Bay (Fremont, Milpitas, San Jose, or Cupertino) this split is worth knowing. Stretching from the crowded $1.5M range into the $1.7–2M range could put you in the part of the market where sellers have the fewest buyers to choose from. Just know that sellers are still averaging 98% of asking price, so this is a market with more selection and more patience, not one where lowball offers land.
Frequently Asked Questions
What was the median home price in Pleasanton in September 2026?
The median sale price for detached single-family homes in Pleasanton was $1,590,000 in September 2026, up 4.13% from $1,527,000 in September 2025. It's the first year-over-year increase since June, following declines in July and August.
Is Pleasanton a buyer's or seller's market right now?
By classic measures, Pleasanton is still a seller's market, with 2.0 months of supply and homes selling at 98% of list price on average in September 2026. Conditions are softer than a year ago, though: months of supply is up from 1.6, and above $1.7 million, sales are running at a five-year low, giving buyers in that range more leverage.
How long are homes taking to sell in Pleasanton?
The average days on market was 37 in September 2026, up from 26 in September 2025 and the highest of the past 13 months. It has risen every month since April 2026, when the average was 14 days. Because this figure resets when a listing is withdrawn and relisted, actual time-to-sell for repriced homes is likely longer.
Are home prices in Pleasanton going up or down?
Prices appear to be stabilizing. In September 2026 the median sale price rose 4.13% and the average sale price rose 0.83% year-over-year, while average price per square foot (816) was essentially flat with September 2025 (813). That follows two months of year-over-year declines in July and August.
Which price segment is strongest right now?
The $1.3–1.699M range is the strongest, with 118 sales year-to-date through September 2026, or 37.2% of all activity, and ahead of the same point in both 2023 and 2024. Every price band above $1.7M is at or tied for its lowest year-to-date sales count since 2022, and the $3M+ segment trails last year's pace by 13 sales (35 vs. 48).
Is now a good time to sell in Pleasanton?
It depends heavily on price point. Below $1.7 million, buyer activity is holding up well by historical standards. Above $1.7 million, there are fewer buyers than in any of the past five years, so precise pricing matters most there. Across the market, well-priced homes are still closing at about 98% of list price.
Closing
Twenty-one years in this market have taught me that a single headline number rarely tells the whole story, and September is a perfect example: a median that went up, in a market where most homes above $1.7 million are selling slower than they have in years. I break the numbers down every month, streaks and reversals both, so you have the full picture. If you're thinking about buying or selling in Pleasanton or anywhere in the Tri-Valley, I'd love to talk through what this data means for your home.
Katie Moe | Connect California Homes | 925-216-9083 | katie@connectcahomes.com | DRE #01507863